
Data Warehouse Examples for UK Mid-Sized Businesses
Data warehouse examples for UK mid-sized firms: illustrative scenarios in retail, manufacturing, services, healthcare admin and finance, with an architecture.
The quick answer
Data warehouse examples show the same pattern in different sectors: pull data from the systems a business already runs, model it around its key questions, and serve reports from one place. The scenarios below are illustrative and hypothetical, not client case studies. They cover retail, manufacturing, professional services, healthcare administration and finance reporting.
Key takeaways
- These are illustrative scenarios built from common patterns, not case studies or client stories.
- Each example starts with a handful of business questions, then works back to the sources.
- The sources differ by sector, but the architecture and the modelling approach are very similar.
- A star schema, with facts and dimensions, is the usual way to shape the data for reporting.
- The outputs are ordinary: dashboards, scheduled packs and a trusted data set for analysts.
What do data warehouse examples look like in practice?
Every example here is an illustrative scenario. None is a case study, and none describes a real client. We have built them from patterns that recur in mid-sized UK organisations, so you can recognise your own situation and see what a warehouse would hold.
The common thread is simple. A business runs several systems, each with part of the picture. A warehouse joins them, applies agreed definitions and stores the result for reporting. If you need the basics first, read what a data warehouse is. For our approach to delivery, see our data warehouse services.
↑ Back to contentsWhich scenarios are covered, and what do they have in common?
The table summarises five hypothetical scenarios. The detail follows in the next sections.
| Scenario | Typical sources | Key questions answered | Typical outputs |
|---|---|---|---|
| Retail and e-commerce | Web shop, payment provider, stock system, marketing tools | Which products and channels earn margin? What is selling out? | Sales and margin dashboard, stock cover report, channel performance |
| Manufacturing | ERP, production records, quality logs, supplier orders | Where is scrap or delay arising? What does each product really cost? | Production and yield dashboard, cost per unit, supplier performance |
| Professional services | Time recording, billing, CRM, HR | Which clients and projects are profitable? Who is under or over utilised? | Utilisation and realisation reports, project margin, pipeline view |
| Healthcare administration | Appointment and booking systems, staffing rota, finance | Where do waits build up? How are admin teams resourced? | Capacity and wait reports, staffing against demand, budget tracking |
| Finance team reporting | Ledger, budgeting tool, payroll, sales and procurement systems | What does the month-end position look like? Where are we against budget? | Management pack, variance analysis, cash and forecast views |
How might a retail or e-commerce business use a data warehouse?
Imagine a mid-sized online and high-street retailer. Orders come from the website and tills, payments are in a payment provider, stock is in an inventory system, and advertising spend sits in marketing platforms. Each system reports its own version of sales.
A warehouse brings these together at order-line level. Sales are tied to product, channel, date, store and customer, and costs are added so margin can be calculated, not only revenue. Returns are attached to the original sale, so a product that sells well but comes back often is visible.
Timing matters in retail. Sales data may need to refresh several times a day during trading peaks, while cost and margin data can refresh overnight. A good design separates the two, so the fast-moving figures are not held up by the slow ones.
The questions it answers are practical. Which channels bring repeat buyers? Which lines are close to selling out? Which promotions raised sales but cut margin? The outputs are a sales and margin dashboard, a stock cover view for buyers and a monthly channel review. This is also where the marketing-side question in data warehouse vs marketing database becomes relevant.
↑ Back to contentsHow might a manufacturer use one?
Picture a hypothetical manufacturer with an ERP for orders and stock, separate records for production runs, a quality system and supplier purchase data. Production, finance and purchasing each have a spreadsheet, and the numbers rarely agree.
The warehouse links a production run to its materials, machine, shift and quality results. That lets finance calculate cost per unit from actual usage, not standard assumptions. It also lets operations see where scrap clusters, such as one machine, one supplier batch or one shift pattern.
Typical outputs are a yield and downtime dashboard, a product cost report and a supplier delivery and quality scorecard. The warehouse also gives planners one place to compare forecast demand with stock and capacity, which is hard when each is held in a separate file. The main challenge is source data: shop-floor records are often incomplete, so a first release usually starts with what is dependable. Our system integration work often supports this step.
↑ Back to contentsHow might a professional services firm use one?
Consider a hypothetical consultancy or accountancy practice. Time is recorded in one tool, invoices raised in another, opportunities held in a CRM, and staff details sit in an HR system. Partners ask basic questions and wait days for answers.
A warehouse joins time, billing, client and staff data. The central measures are utilisation (billable time against available time), realisation (what was billed against what the time was worth) and project margin. Because staff move teams and rates change, history matters, and the model needs to keep it.
The outputs are a partner dashboard, a client profitability report and a pipeline against capacity view. A common mistake here is defining utilisation differently in each team. The warehouse is a good place to settle it once. Our business intelligence consultants often start with that definition.
↑ Back to contentsHow might healthcare administration use one?
Take a hypothetical private clinic group or an administrative team supporting care providers. The scenario here is about operations and finance, not clinical decisions. Data comes from booking systems, staff rotas, room and equipment schedules and finance.
A warehouse lets managers compare demand with capacity: appointments requested, booked, missed and cancelled, against staff and room availability. It can show where waiting builds up and how admin time is spread.
Personal data needs particular care. Health information is special category data under UK GDPR, so we would aim to use de-identified or aggregated data wherever the question allows, limit access by role, and keep retention rules clear. Take specialist advice on your own obligations. Our managed security team covers the protective controls.
↑ Back to contentsHow might a finance team use one for reporting?
This is the example we see in the most sectors. A finance team closes the month by exporting from the ledger, the budget tool, payroll and sales systems, then reconciling in Excel. It is slow and hard to audit.
A warehouse stores ledger transactions with their cost centre, project, period and budget version, and joins sales and payroll data where analysis needs it. Reports refresh from the same model each month. Variances can be explained down to transaction level, which shortens review.
Audit is a quiet benefit. Because each reported figure traces back to loaded transactions, a reviewer can follow a number from the pack to the ledger without asking someone to rebuild it. Outputs include a management pack, budget variance analysis and a cash and forecast view. For related guides, see automating monthly management reports and real-time financial dashboards. If the source is Dynamics 365 Business Central, our Business Central partner page is relevant.
↑ Back to contentsWhat does an example architecture look like?
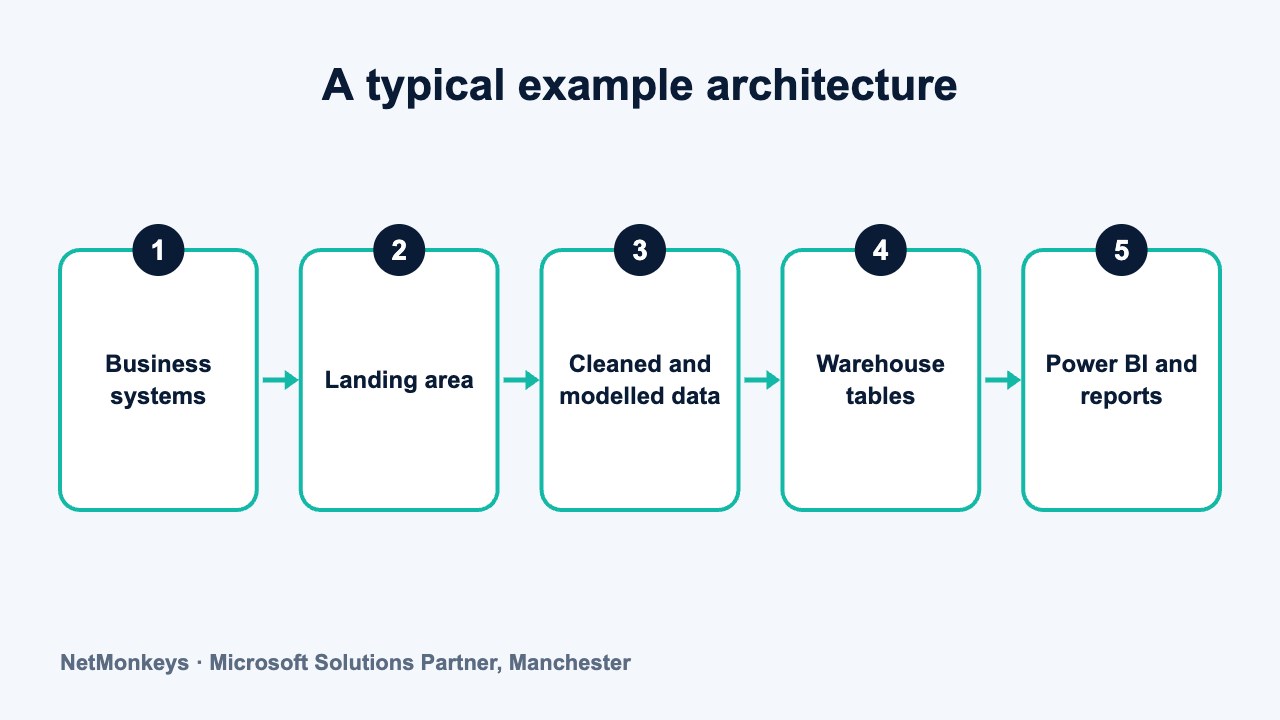
The architecture below is a generic pattern, not a design for any particular client. Platform choices vary, and you should check each vendor's current documentation. We compare options in data warehouse platforms and set out design needs in architecture requirements.
- Sources: ERP, CRM, finance, web and operational systems, each with its own format and refresh pattern.
- Ingestion: scheduled or event-driven loads copy data out of the sources without changing them.
- Landing area: raw data is stored as received, so any later step can be re-run and checked.
- Transformation: data is cleaned, matched and given agreed definitions, with rules written down.
- Warehouse layer: modelled tables hold facts and dimensions with history where needed.
- Semantic and reporting layer: a shared model feeds Power BI and scheduled reports.
- Governance and monitoring: access control, load monitoring, lineage and retention run across every layer.
For a Microsoft-centred estate, the cloud platform is often Azure. See our Azure cloud services page, or the cluster guide to Azure data warehouse options.
↑ Back to contentsWhat does an example star schema look like?
A star schema puts a central fact table, which records events or measures, at the middle, with dimension tables around it that describe who, what, where and when. It is the usual way to shape warehouse data for reporting. The table below describes a hypothetical retail sales model in words. For design principles, see data warehouse design.
| Table | Type | What it holds | Example columns |
|---|---|---|---|
| Sales line | Fact | One row per product on an order | Order key, product key, customer key, date key, quantity, net value, cost |
| Product | Dimension | Descriptive product attributes | Product code, name, category, supplier, status |
| Customer | Dimension | Customer details, with history of changes | Customer ID, segment, region, start date, end date |
| Date | Dimension | Calendar and fiscal periods | Date, week, month, fiscal period, holiday flag |
| Channel | Dimension | How the order was placed | Channel name, store or site, campaign group |
| Returns line | Fact | One row per returned item | Order key, product key, date key, quantity, reason |
What we would check first
Write down the grain of each fact table before building: one row per what? 'One row per order line' and 'one row per order' give different answers to the same question. Most reporting errors we see in models trace back to an unclear grain.
What typically goes wrong in these scenarios?
Examples tend to show the tidy version. In practice, the same handful of problems appear whatever the sector, and knowing them in advance saves time.
- Unclear ownership: nobody can say which team decides what 'a sale', 'a project' or 'an appointment' means, so reports keep disagreeing.
- Poor source data: missing codes, free-text fields and duplicate records slow the build and limit what can be reported reliably.
- Too much at once: trying to cover every department in the first release delays value and tires the sponsors.
- No plan for change: sources are upgraded or replaced, and loads break because nobody was told.
- Reports built before the model: dashboards are made from raw extracts, then rebuilt when the warehouse arrives.
Each of these can be managed. The usual remedy is a short discovery phase that lists the questions, checks the source data and names the owners before a single table is built. Our data migration services page describes the data preparation side, which overlaps with warehouse loading.
↑ Back to contentsWhat should you take from these examples?
None of the scenarios depends on a fashionable tool. They depend on clear questions, sound data and people who use the output week after week. If those three are in place, the platform choice becomes a practical decision about cost, skills and fit. Three points repeat across the scenarios. First, each begins with questions, not with technology. Second, the hardest work is agreeing definitions and cleaning sources, not choosing a platform. Third, the first release is small. It covers one area well and grows from there.
Your sector will have its own twists, and the right design depends on your systems, volumes and skills. NetMonkeys is a Manchester-based Microsoft Solutions Partner. If you want to talk through your own scenario, our data warehouse consultancy can help you list the questions and the sources. You may also want to read about the benefits of a data warehouse and where it may not be worth it.
↑ Back to contentsFrequently asked questions
Are these real client case studies?
No. Every scenario in this article is illustrative and hypothetical, built from common patterns in UK mid-sized organisations. They contain no client names, figures or results, and they should not be read as outcomes we have delivered.
What is a typical first data warehouse project?
A narrow one. Many start with finance reporting or sales analysis, because the sources are well defined and the questions are clear. A first release that covers one area well builds trust and shows what a wider build would involve.
Which source systems do data warehouses usually draw on?
Common sources include ERP and finance systems, CRM, e-commerce platforms, HR and payroll, time recording and operational tools. The mix depends on the questions you want answered. We would list the questions first and choose the sources from them.
What is a star schema in simple terms?
It is a way of arranging data for reporting. A central table records measurable events, such as sales lines, and surrounding tables describe them, such as product, customer and date. It is easy to understand and works well with BI tools.
Can a small or mid-sized business use a data warehouse?
Yes, if it has several systems to combine, needs history and has people to use the output. A business with one system and simple reporting may not need one. A direct Power BI connection can be a sensible first step.
Do all examples need the same architecture?
The shape is similar, with sources, loading, modelling and reporting, but the detail varies. Volumes, refresh needs, data sensitivity, existing Microsoft licences and in-house skills all affect the design, so treat any example architecture as a starting point.
About this guide and NetMonkeys
Written by Caleb Adoh, Growth Marketing Manager at NetMonkeys. NetMonkeys is a Manchester-based Microsoft Solutions Partner offering data warehouse services, Power BI services and business intelligence consultancy. This guide explains general data warehousing practice. Vendor products and features change, so check the current vendor documentation before making platform decisions.
Planning a data warehouse?
Talk to NetMonkeys about what you need to report on, where your data lives and which approach fits your business.
Explore data warehouse services Contact the team