
Data Warehouse Design: A Step-by-Step Process
Data warehouse design explained step by step: business questions, grain, facts and dimensions, star schemas, ETL, testing, security and common mistakes.
The quick answer
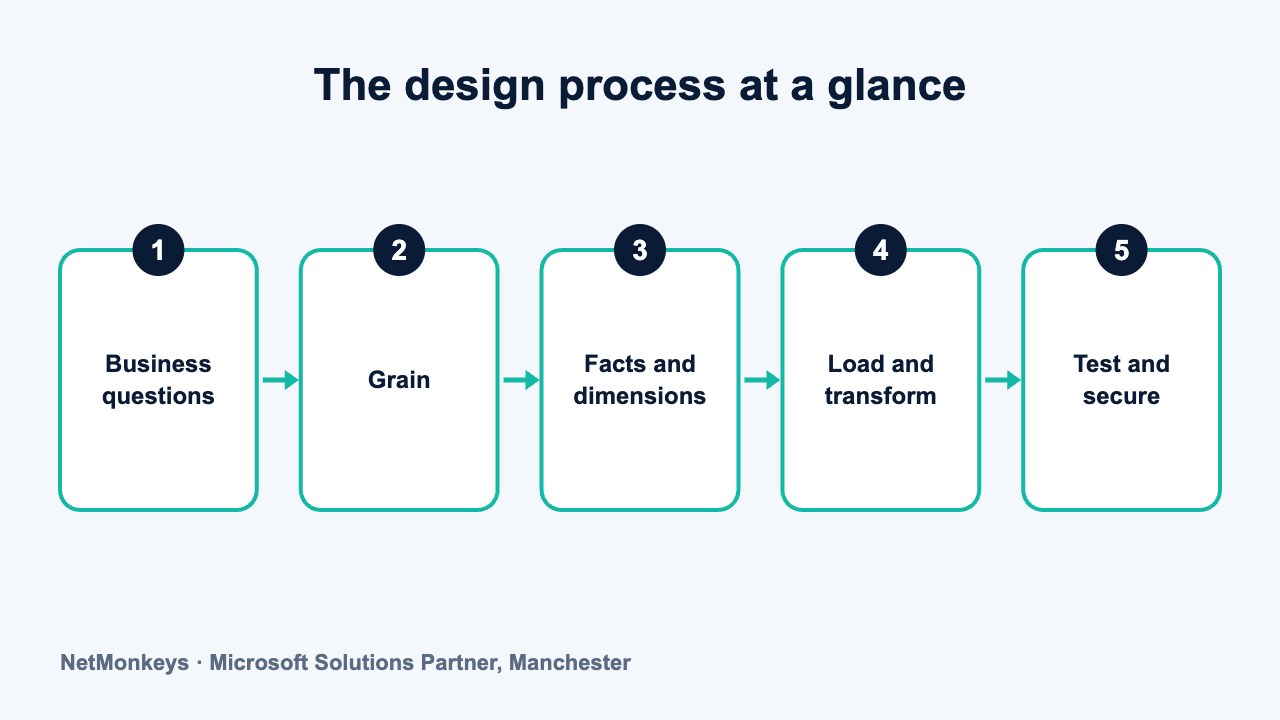
Data warehouse design is the process of deciding what a warehouse must answer, then shaping the data to answer it. You agree the business questions, choose the grain of each fact table, define the facts and dimensions, build a dimensional model, design the loading process, and test the result. Good design is mostly about decisions made before any tool is chosen.
Key takeaways
- Start with business questions, not source systems or tools.
- Choose the grain of each fact table before anything else in the model.
- A star schema with conformed dimensions suits most reporting warehouses.
- Design the loading, testing and security from the start, not after the model.
- Most failed designs skip the questions step or mix grains in one table.
What is data warehouse design?
Data warehouse design is the work of deciding how data from your business systems will be stored, shaped and loaded so people can report on it reliably. It covers the model (the tables and how they relate), the pipeline that fills them, and the controls around quality and access.
It is different from choosing a platform. A well-designed warehouse can run on several products, and a poorly designed one will disappoint on any of them. If you need the basics first, start with what a data warehouse is.
The design is also not a one-off event. The first version should cover a small, valuable set of questions, and the model should be built so that later subject areas can be added without rebuilding what already exists. Our data warehouse services follow this pattern, but the steps below apply whoever does the work.
↑ Back to contentsHow do you design a data warehouse, step by step?
The sequence below is the one most dimensional projects follow, with small variations. Each step produces something you can review with the business before moving on.
- Agree the business questions. List the decisions people need to make and the questions they ask repeatedly. Rank them by value and by how easy the data is to reach.
- Profile the source data. Check what each source system actually holds, how clean it is, and how often it changes. This often changes the scope.
- Choose the grain. Decide what one row in each fact table represents, such as one invoice line or one support ticket.
- Identify the facts and dimensions. Facts are the numbers you measure. Dimensions are the context you slice them by, such as customer, product or date.
- Build the dimensional model. Draw the star schemas and agree names, keys and definitions with the business.
- Design staging and transformation. Decide how data lands, is cleaned, and is loaded into the model, whether by ETL or ELT.
- Plan testing and data quality. Define the checks that prove the numbers match the source and the business rules.
- Design performance and security. Set partitioning, indexing or clustering choices, and decide who can see which data.
- Release a first subject area. Deliver one slice end to end, gather feedback, and then extend.
Why should design start with business questions?
A warehouse exists to answer questions. If you start from the source systems, you tend to copy their structure, which produces a large store of data that nobody trusts or uses. If you start from questions, every table has a reason to exist.
When we scope a warehouse, we start with the questions the business needs answered, then work back to the data. Good questions are specific. "How is sales performing?" is vague. "What was gross margin by product family and region last month compared with the same month last year?" tells you the measures, the dimensions and the time comparison you need.
Record who owns each question and how it is calculated today. Disagreements about definitions, such as what counts as an active customer, are far cheaper to settle at this stage than after the dashboards are built. Our guide to improving data accuracy across departments covers the same problem from the reporting side.
What we would check first
Ask three people in different departments to define the same measure, such as revenue or headcount. If you get three answers, the first design task is agreeing one definition, not drawing tables.
What is the grain, and why does it come first?
The grain is the level of detail of one row in a fact table. Examples are one line on a sales invoice, one daily balance per account, or one ticket status change. Every other decision follows from it.
Choosing the grain first stops you mixing levels of detail in one table. If a table holds both invoice headers and invoice lines, totals will double count and nobody will know why. Where possible, pick the lowest grain the source can supply. You can always summarise detail upwards, but you cannot recover detail you discarded.
State the grain in one plain sentence and get the business to confirm it. Then check that every dimension you add makes sense at that grain. A product dimension belongs on an invoice-line fact. A delivery driver might not belong on a monthly summary.
↑ Back to contentsHow do you identify facts and dimensions?
Once the grain is fixed, ask two questions. What is measured at this grain? Those are your facts. How would people describe, filter or group those measurements? Those are your dimensions.
| Aspect | Facts | Dimensions |
|---|---|---|
| Purpose | Hold the measurements of a business event | Describe the who, what, where and when of the event |
| Typical content | Quantities, amounts, durations, counts | Names, categories, dates, regions, statuses |
| Row volume | Large, grows with every transaction | Smaller, changes slowly |
| Examples | Sales amount, units sold, ticket handling time | Customer, product, date, branch, employee |
Be careful with measures that cannot be added across all dimensions, such as account balances or stock levels. These are semi-additive, and your reporting tool must treat them differently over time. Note them in the design so nobody sums them by accident.
Build a shared date dimension early. It is reused by almost every fact table and is where fiscal calendars, working days and holidays are handled once, rather than in every report.
↑ Back to contentsWhat are dimensional modelling and a star schema?
Dimensional modelling organises data into fact tables surrounded by dimension tables. Drawn out, a fact table sits in the middle with dimensions around it, which is why it is called a star schema. It is popular because business users find it easy to read and reporting tools query it efficiently.
A snowflake schema splits dimensions into further linked tables to reduce repetition. That saves some storage but adds joins and makes the model harder to understand. For most reporting warehouses, a plain star is the better starting point.
Dimensions should share definitions across fact tables. A single customer dimension used by sales, support and billing lets you compare them in one report. Where history matters, decide how each dimension attribute handles change, for example overwriting a value or keeping a new row for each version. For a book-length treatment, see our guide to The Data Warehouse Toolkit.
If your reports run in Power BI, a star schema also fits how the tool is designed to work. Our Power BI services specialists can help here, because a clean model often removes the need for complicated report formulas.
↑ Back to contentsHow should you design staging and ETL or ELT?
Staging is the landing area where raw data arrives before it is cleaned and loaded into the model. Keeping a staging layer lets you reload without going back to the source, and gives you somewhere to investigate problems.
ETL transforms data before it reaches the warehouse. ELT loads it first and transforms it using the warehouse's own processing power. Cloud platforms have made ELT common, but the choice depends on volumes, skills and where you want business rules to live.
- Load pattern. Decide between full reloads and incremental loads based on source size and how reliably the source flags changed rows.
- Keys. Use warehouse-generated surrogate keys in dimensions, and keep the source system's key as an attribute so rows can be traced back.
- Late and missing data. Plan for facts that arrive before their dimension row exists, rather than dropping them.
- Restartability. Design each load so that it can be re-run safely after a failure without duplicating rows.
- Logging. Record row counts, start and end times and rejected rows for every run.
Bringing several systems together raises its own design questions about keys and timing. Our guide to combining data from multiple systems into one dashboard covers the practical side of this.
↑ Back to contentsHow do you test a warehouse and protect data quality?
Testing is part of the design, not a final phase. Decide up front what "correct" means, then build checks that run on every load.
Start with reconciliation. Totals in the warehouse should match the source for the same period, and any difference should be explained. Then add rules for the data itself: no null keys, no duplicate dimension members, values within expected ranges, and dates that make sense.
Finally, test with the people who will use the numbers. Ask them to reproduce a few figures they already trust. If they cannot, find out why before the model goes live. Where checks fail in production, route the failed rows to a review table and alert someone, rather than loading them silently.
Common mistake
Teams often test only that the pipeline ran, not that the numbers are right. A load can finish without errors and still be wrong. Reconciliation against the source should be an automatic part of every run.
What performance and security choices belong in the design?
Performance starts with the model. A clean star schema, the right grain and sensible data types do more than any tuning later. After that, the options depend on the platform: partitioning large fact tables by date, choosing clustering or distribution keys, and creating summary tables for the heaviest reports.
Security should be designed at the same time. Decide which roles need which data, and whether restrictions apply at row level, such as a regional manager seeing only their own region. Classify personal data early, because it affects what you load, how long you keep it and who can query it. Under UK GDPR you should only hold personal data you need, so avoid copying every column from the source by default.
For Microsoft environments, platform choices and access controls sit alongside your wider Azure cloud services and security arrangements, so involve whoever owns those early.
↑ Back to contentsWhich design decisions involve trade-offs?
Few design choices are right in every case. The table below sets out the decisions that come up most often and what each choice costs you.
| Decision | Option A | Option B | Trade-off |
|---|---|---|---|
| Schema shape | Star schema | Snowflake schema | Star is simpler to query and understand. Snowflake reduces repetition but adds joins. |
| Fact grain | Lowest-level detail | Pre-summarised | Detail answers more questions but is larger. Summaries are faster but limit analysis. |
| Transformation | ETL before loading | ELT inside the warehouse | ETL controls data before it lands. ELT is flexible and scales with the platform. |
| Load method | Full reload | Incremental load | Full reloads are simple but slow at scale. Incremental needs reliable change tracking. |
| History in dimensions | Overwrite old values | Keep a row per version | Overwriting is simple. Keeping history supports accurate past reporting but adds complexity. |
| Delivery | One large build | Subject area by subject area | A large build gives a complete picture later. Incremental delivery shows value sooner. |
Record each decision and the reason for it. Six months later, when someone asks why the model is built this way, that note saves a lot of time.
↑ Back to contentsWhat are the most common data warehouse design mistakes?
- Skipping the business questions. The warehouse mirrors the source systems and answers nothing in particular.
- Mixing grains. One fact table holds rows at different levels of detail, so totals are wrong.
- Building everything at once. A year-long build with no early release loses sponsor support and misses changing needs.
- No agreed definitions. Each department keeps its own version of a measure, so the warehouse adds another set of numbers.
- Ignoring data quality at source. Problems are loaded, not fixed, and trust is lost the first time a report is wrong.
- Leaving security to the end. Retrofitting row-level access or removing personal data is harder than designing for it.
- Choosing the tool first. The platform decision drives the design, rather than the other way round.
A warehouse is not always the answer. If you have a single source system and a handful of reports, a well-built semantic model in your reporting tool may be enough. Our business intelligence consultants can help you test that before you commit to a build.
If you want an experienced team to run the design, a data warehouse consultancy can run the questions workshops and model reviews with you. Before that, it helps to document your data warehouse architecture requirements.
↑ Back to contentsFrequently asked questions
How long does it take to design a data warehouse?
It depends on the number of source systems, how clean the data is and how quickly the business agrees definitions. A first subject area is usually designed in weeks, not months. A full enterprise model takes longer and is best delivered in stages.
What is the first step in data warehouse design?
Agree the business questions the warehouse must answer. Everything else, including the grain, the facts and the dimensions, is derived from those questions. Starting from source systems or tools tends to produce a model that nobody uses.
Is a star schema always the best choice?
It is the best starting point for most reporting warehouses because it is easy to understand and query. Other approaches, such as data vault, suit cases with many changing sources and strict audit needs. See our comparison of data vault and data warehouse approaches.
Do I need ETL or ELT?
Either can work. ETL transforms data before loading and suits tight control over what enters the warehouse. ELT loads raw data first and transforms it inside the platform, which is common on cloud systems. The right choice depends on data volumes, team skills and where you want business rules to sit.
Who should be involved in data warehouse design?
You need business users who know the questions and definitions, someone who understands the source systems, and a data modeller or engineer who builds the design. A named business owner for each subject area keeps decisions moving.
Can I change the design after the warehouse is live?
Yes, but changes are cheaper if you planned for them. Conformed dimensions, clear documentation and incremental loads make it easier to add new subject areas. Changing the grain of an existing fact table is the most disruptive change, so confirm it early.
About this guide and NetMonkeys
Written by Caleb Adoh, Growth Marketing Manager at NetMonkeys. NetMonkeys is a Manchester-based Microsoft Solutions Partner offering data warehouse services, Power BI services and business intelligence consultancy. This guide explains general data warehousing practice. Vendor products and features change, so check the current vendor documentation before making platform decisions.
Planning a data warehouse?
Talk to NetMonkeys about what you need to report on, where your data lives and which approach fits your business.
Explore data warehouse services Contact the team