
How to Audit Your MSP's SLA Reports (And What They Can Miss)
Learn how to audit MSP SLA reports beyond a headline figure: paused clocks, averages, reopened tickets, categories and user satisfaction, with a checklist.
The quick answer
To audit MSP SLA reports, ask for the underlying ticket data, not just the summary percentage. A figure such as 99% achieved can be accurate and still hide paused clocks, response-only measures, reclassified priorities, reopened or auto-closed tickets and a long tail of slow cases. Check the definitions, sample real tickets, and ask your own users how the service feels.
Who this is for: Operations Managers and IT Directors
Key takeaways
- A headline SLA percentage is a summary. It shows what was measured, not necessarily what your users experienced.
- Check what the clock measures: response is not resolution, and a paused clock is not the same as a resolved problem.
- Averages hide long tails. Ask for medians, percentiles and the slowest ten tickets.
- Reopened, auto-closed and reclassified tickets are the most common reasons a report looks better than the service feels.
- Pair the report with direct user feedback and a 60-minute review meeting each quarter.
Why is a headline SLA figure not enough?
A headline figure such as '99% of SLAs met' is a summary of a summary. It compresses thousands of tickets, several priority levels and a set of contract definitions into one number. The number may be entirely accurate. It simply cannot tell you whether the people in your business feel well supported.
This guide is for operations managers and IT directors who receive a monthly report and want to know how much weight to put on it. It assumes good faith on the part of providers. Most reporting problems come from definitions the buyer did not read, tooling defaults and ambiguity, not from anyone trying to mislead. The aim is a better conversation, not an accusation.
We do not repeat the basics of response and resolution commitments here. If you need those first, read our plain-English guide to IT support SLAs and return to this one when you want to test a report in practice.
- Definitions drive the number: change what counts as a response or a resolution and the percentage changes without any change in service.
- Aggregation hides detail: a monthly figure averages across priorities, teams and days.
- Tooling shapes reporting: a service desk platform has default behaviours, such as automatic closure, that affect the outcome.
- Experience is not in the data: a ticket resolved within target can still leave a user frustrated.
Practical tip
Treat the SLA report as the start of a review, not the end. The most useful question to ask of any figure is 'what is this number made from?'.
What does a typical SLA report actually measure?
Most SLA reports are produced automatically by the service desk system. They count tickets, compare timestamps against targets and calculate a percentage met. The logic behind that calculation is set by configuration, which the provider controls and the contract may or may not describe.
Before you analyse anything, ask for a one-page statement of how each measure is calculated. It should cover which timestamps start and stop each clock, which statuses pause it, which ticket types are included and which are excluded. A provider with a mature reporting process will have this ready. If it does not exist, writing it down is a useful first outcome.
The questions that define every number
- When does the clock start? At the moment the user raises the issue, when the ticket is created, or when a person first triages it.
- What counts as a response? An automatic acknowledgement email, a first human reply, or the start of actual work.
- What counts as resolved? The fix is applied, the user confirms, or the ticket is closed in the system.
- Which statuses pause the clock? For example, awaiting user, awaiting third party, scheduled or on hold.
- Which tickets are excluded? Projects, requests, alerts raised by monitoring, or tickets in particular categories.
- Who sets the priority, and can it change? At logging, at triage, or at any point.
None of these choices is wrong in itself. Pausing a clock while waiting for a user to reply is fair, because the provider cannot fix the problem without input. The issue is whether the pause is applied consistently and whether you can see how much time was paused.
↑ Back to contentsHow do paused clocks, response times and resolution times change the picture?
Three distinctions account for most of the gap between a good report and a poor experience. They are the pause, the difference between response and resolution, and the choice of where the clock stops.
Paused clocks
Clock pauses exist for good reasons. A ticket waiting for a supplier or a user is not under the provider's control. Problems arise when a pause status is used broadly, for example when a ticket is marked 'awaiting user' after one unanswered message and stays paused for days, or when a status such as 'scheduled' is applied to work that could have been done sooner.
Where engineers attend site, check that travel and waiting time follow the same rules, as set out in the onsite IT support guide. Ask for two durations on each sampled ticket: total elapsed time and active time. A large gap is not proof of a problem, but it tells you where to look. If most of the gap sits in one status, ask what that status means in practice.
Response versus resolution
Response time measures how quickly someone acknowledges the ticket. Resolution time measures how long it takes to fix. A provider can meet every response target and still be slow to resolve. Users care about the second measure, while many reports lead with the first.
If your report shows only response performance, ask for resolution performance by priority. If the contract has no resolution target, that is a point for the next contract renewal review.
Where the clock stops
A ticket may be marked resolved when the engineer applies a fix, when the user confirms, or after a period of silence. These produce different timings and different satisfaction outcomes. Confirmed resolution is the most reliable of the three but the slowest to record.
Common mistake
Accepting a monthly percentage without checking whether it measures response or resolution. Ask for both, split by priority, in the same report.
How can priorities and categories change the result?
Priority levels set the target for each ticket. A priority 1 issue may have a very short target and a priority 4 request may have a long one. Because targets differ, the mix of tickets in a month has a direct effect on the headline percentage, even when the service is unchanged.
If most tickets are logged at a lower priority, the overall result tends to look better. If a user describes an urgent problem and it is logged as routine, the clock runs to a more generous target. This can happen innocently, since triage is a judgement and users often under- or over-describe impact. It is still worth examining.
- Priority distribution: what share of tickets sits in each priority, and has that mix shifted over the last six months?
- Priority changes: how many tickets were re-prioritised after logging, and by whom?
- Category exclusions: are any categories, such as requests, alerts or projects, excluded from SLA reporting?
- Impact definitions: who decides how many users are affected, and does a single executive's problem count the same as a team outage?
- Out-of-hours handling: do tickets raised overnight start the clock when raised or at the start of the next business day, and does the contract include 24/7 IT support?
Our overview of the levels of IT support explains how tickets are typically escalated. In an audit, check that escalated tickets keep their original clock rather than restarting at each level. Some systems restart timers on reassignment by default.
What we would check first
Take the five tickets that users complained about most in the last quarter and trace how each was categorised and prioritised. If the complaints cluster in tickets that were met within SLA, the definitions need a conversation.
What do reopened and auto-closed tickets hide?
Reopened and auto-closed tickets are the most common reason a report looks better than the service feels. Both are tied to how the system defines 'resolved'.
Reopened tickets
When a fix does not hold, a user may reply to the closed ticket, or may raise a fresh one. In some systems the original ticket reopens and the clock continues. In others a new ticket is created and the original counts as a success. In the second case a problem that took three attempts to fix appears as three separate tickets, perhaps two of which met their targets.
Ask for the reopen rate and for repeat tickets from the same user on the same topic within a short window. A rising rate suggests that fixes are being applied quickly but not durably.
Auto-closed tickets
Many service desks close a ticket automatically if the user has not responded for a set number of days. This is sensible housekeeping, since open tickets with no activity clutter the queue. But an auto-closed ticket may be one where the user gave up, or was waiting for an answer they never received.
Ask what proportion of closed tickets were auto-closed, and how many of those were later reopened or re-raised. If the figure is high, ask what the follow-up process is before closure.
- Reopen rate: reopened tickets as a share of closed tickets, by category.
- Repeat contacts: the same user or system appearing again within a week or two.
- Auto-closure share: the proportion closed by the system rather than by an engineer or a user.
- Closure notes: do engineers record what was done, or are many closed with no detail?
Repeat issues are also useful evidence for improvement work. A pattern of the same fault across many users points to a root cause that should be fixed once, which is what a monitoring-led service aims to do. The point is covered in our guide to remote IT support.
↑ Back to contentsHow do averages hide long tails?
An average resolution time is easy to report and easy to misread. A set of ninety quick fixes and ten that took very long can produce a comfortable average, while those ten were the tickets that affected people most. The mean is a poor guide to the worst experiences.
Two better measures are the median, which shows the typical ticket, and a high percentile such as the 90th, which shows how long the slower tickets take. The gap between them indicates how long the tail is. A small gap suggests consistent performance. A large gap suggests that some tickets are getting stuck.
- Median time to resolve: the middle ticket, which is not distorted by a few extreme cases.
- 90th percentile: the time within which nine in ten tickets are resolved, a view of the slower end.
- Oldest open tickets: a list of the longest-running items, with their age and status.
- Backlog trend: the number of open tickets at month end over the last six months.
An illustrative scenario
This scenario is illustrative. A 120-person firm receives a monthly report showing average resolution well inside target. When the operations manager asks for the ten slowest tickets, nine relate to one line-of-business application and one to a recurring printer fault, and all were paused awaiting a third-party vendor. The average was accurate. The tail showed a supplier management gap that the average could not.
The remedy was not a dispute. It was an agreed owner for vendor escalation and a monthly review of tickets older than a defined number of days. Without the question, the report would have continued to look fine.
Practical tip
Ask for the report to include the median, the 90th percentile and the ten oldest open tickets in every monthly pack. The extra effort is small for a provider whose data is in good order.
Which metrics should you ask for, and what do they miss?
The table below summarises the metrics most commonly found in an SLA pack. For each, it sets out what the figure shows, what it can hide and a better question to ask. Use it as a template for the next review.
| Metric | What it shows | What it can hide | A better question |
|---|---|---|---|
| Overall SLA percentage | The share of tickets that met their target in the period | The mix of priorities, excluded categories and the length of any breach | What is the percentage by priority, and which categories are excluded? |
| First response time | How quickly tickets were acknowledged | Whether an automated reply counts and how long the fix took | Is the response automatic or human, and what is the resolution time for the same tickets? |
| Time to resolve (mean) | The average duration across tickets | A long tail of slow tickets masked by many quick ones | What are the median and 90th percentile, and which are the ten oldest open tickets? |
| Time to resolve (active) | Resolution time excluding paused periods | How much time sat in paused statuses and why | How much total elapsed time was paused, and in which statuses? |
| Reopen rate | How often closed tickets came back | Repeat tickets raised as new items | How many repeat tickets from the same user on the same topic within 14 days? |
| Auto-closed share | Proportion closed by the system after inactivity | Users who gave up or never received an answer | How many auto-closed tickets were re-raised, and is there a follow-up before closure? |
| Customer satisfaction score | Survey scores on closed tickets | Low response rates and survey bias toward quick wins | What is the response rate, and how are low scores followed up? |
| Backlog | Open tickets at period end | Whether ageing tickets are being deferred | What is the age profile of open tickets? |
Not every provider will be able to supply all of these immediately. Many will be able to supply most from the service desk system. The willingness to share raw data, and to explain it, is itself useful evidence of how the relationship will work. If you are comparing providers, our guide to choosing an IT support company includes questions on reporting transparency.
↑ Back to contentsHow do you audit end-user satisfaction?
An SLA measures process. Satisfaction measures outcome. You need both, because a provider can hit every target while users lose confidence in the service, and the reverse can also happen. The ticket data tells you what was recorded. Your users tell you what happened.
What the satisfaction score may not show
Satisfaction surveys sent on ticket closure usually have a low response rate, and the people who reply tend to be those with the strongest views or the quickest wins. A high score from a small sample is a weak signal. Ask for the response rate, the score by category and what was done about low scores.
Ways to gather direct feedback
- Short pulse survey: three or four questions sent by your own team to a sample of users each quarter, covering speed, clarity, outcome and confidence.
- Ticket follow-up calls: ask ten users, chosen at random, about a ticket raised in the last month, not just the ones that went well.
- Team-leader check-in: a short conversation with department heads about recurring frustrations and workarounds.
- Complaint log: keep a simple record of informal complaints that never become tickets.
- Shadow reporting: compare the issues people mention with what appears in the ticket data.
The last item is often the most revealing. If users say that printing has been unreliable for weeks and the ticket data shows two resolved printer tickets, either users are not logging issues or issues are being closed too early. Both are fixable.
Common mistake
Relying only on the provider's own survey. Run your own, short and independent, at least twice a year, and compare it with the provider's data.
What does a complete SLA audit checklist look like?
Use the checklist below once a quarter, or before a contract renewal. It is intended to be completed with the provider in the room, with the raw data available, not as an exercise in finding fault.
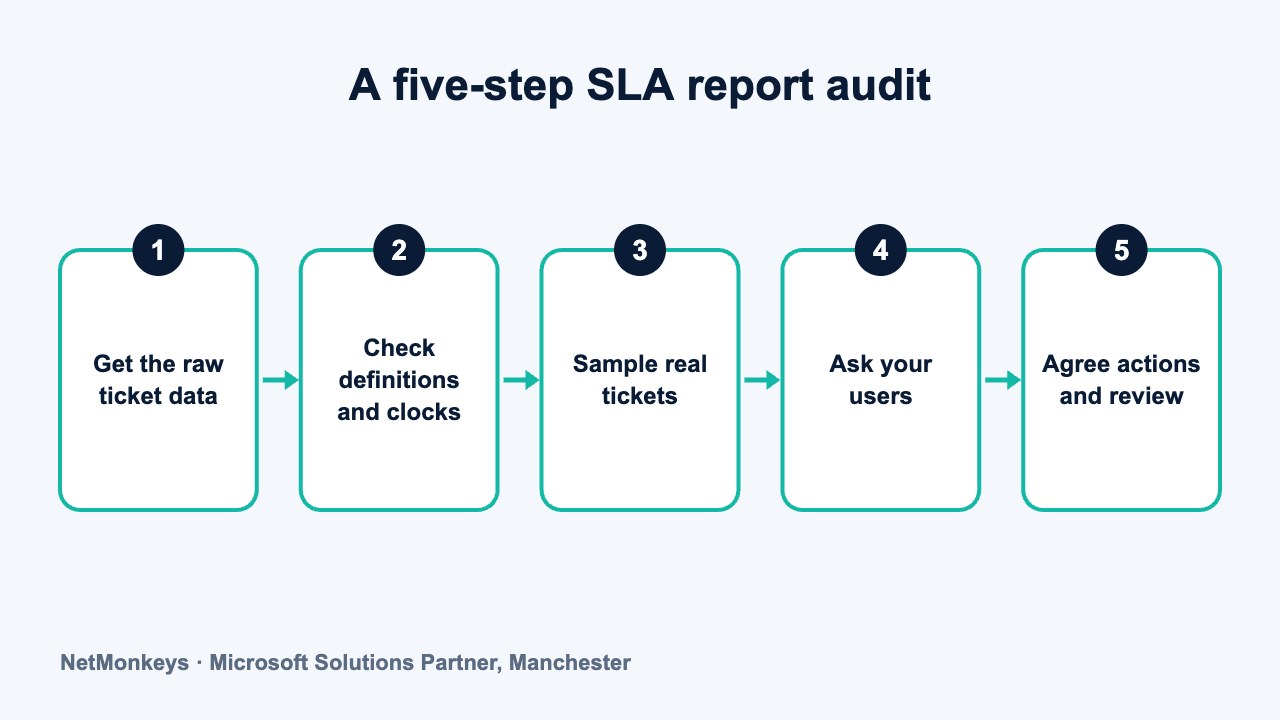
- Definitions: a written statement of start and stop points, pause statuses and exclusions has been supplied.
- Raw data: a ticket-level export for the period has been supplied, including created, first response, resolved and closed timestamps.
- Priority mix: the distribution of tickets by priority is shown, with the number of re-prioritised tickets.
- Response and resolution: both are reported by priority, with the median and 90th percentile.
- Pauses: total paused time and the statuses responsible are visible.
- Reopens and repeats: reopen rate and repeat contacts are reported.
- Auto-closure: the share of auto-closed tickets and their re-raise rate are reported.
- Oldest open tickets: the ten longest-running items have an owner and an action.
- Sample check: ten randomly chosen tickets have been read end to end against the report.
- User view: independent satisfaction feedback has been gathered and compared with the report.
- Actions: each finding has an owner, a deadline and a follow-up date.
A sample check of ten tickets takes about half an hour and teaches more than the summary page. Pick them yourself, including several from users who have complained, so that the selection is not curated. Read the ticket notes as a user would, and ask whether the closure reflects what happened.
What we would check first
The ten randomly selected tickets. Compare the timestamps, the status changes and the closure notes against the figures in the monthly report. Differences are usually definitional and can be resolved in one conversation.
What does a 60-minute SLA audit meeting look like?
A structured meeting keeps the review factual and prevents it becoming a debate about individual incidents. The agenda below is designed for the operations or IT lead, the provider's account or service delivery manager and, where relevant, a finance or business representative.
| Time | Item | Output |
|---|---|---|
| 0 to 5 minutes | Purpose and ground rules: shared goal of accurate reporting and better service | Agreed focus and no-blame tone |
| 5 to 15 minutes | Definitions walk-through: clocks, pauses, exclusions, priorities | Written definitions confirmed or corrected |
| 15 to 30 minutes | Metrics review: priority mix, median and 90th percentile, reopen and auto-closure rates | Three to five observations |
| 30 to 40 minutes | Sample ticket review: five tickets chosen by the customer | Agreed view on whether closures were fair |
| 40 to 50 minutes | User feedback: pulse survey results, complaints and recurring issues | Prioritised list of experience gaps |
| 50 to 60 minutes | Actions: owners, deadlines, report format changes, next date | Action log circulated within 24 hours |
Circulate the data pack two working days before the meeting, so that time is spent on interpretation instead of reading. After the meeting, record changes to the monthly report format and track them. Over a few quarters the reporting tends to become clearer, and the conversation shifts from 'is the number right?' to 'what should we improve?'
If you are using this audit to decide whether to stay with a provider, take care to separate reporting issues, which are usually fixable, from capability issues, which may not be. Our article on signs a business has outgrown its IT provider helps with that judgement, and a guide to switching providers without downtime is there if you decide a change is needed.
↑ Back to contentsWhat should you do with what you find?
Most audit findings fall into one of three groups: definitions to clarify, reports to improve and service issues to fix. Treat each differently, in line with why IT support matters to the business, and keep the tone constructive. A provider that wants the contract to work will normally welcome clearer measures.
- Clarify definitions: agree a written reporting standard and attach it to the contract as a schedule.
- Improve reporting: add percentiles, pauses, reopens and oldest tickets to the monthly pack.
- Fix service issues: assign an owner, a deadline and a measure to each recurring cause.
- Re-baseline targets: if definitions change, record the effect on historic figures so trends stay comparable.
- Escalate when needed: if findings are not acted on over two quarters, move the discussion to senior level and refer to the contract.
Where the contract lacks the measures you need, use the next renewal to add them. Our IT services buyer's guide for 50+ users and the 90-day transition plan show how to set reporting expectations from the beginning of a relationship.
A strategic technology adviser can also help you build the measurement framework without taking sides. A virtual CIO service or a short IT consultancy review can do that, and a good managed IT support provider should be comfortable with the scrutiny. If you would like to test your current provider's report, or see how another approach would look, get in touch.
Practical tip
Keep the audit short and regular. A one-hour quarterly review that finds small gaps early is more productive than an annual review that finds large ones too late.
Frequently asked questions
What is a good SLA percentage for an MSP?
The figure matters less than what it is made from. A high percentage that measures only automatic acknowledgements says little, while a lower one that measures confirmed resolution may represent better service. Ask for the definition, the priority mix and the median and 90th percentile.
Is it normal for the SLA clock to pause?
Yes. Pausing while waiting for a user or a third party is common and reasonable. The audit question is how much time is paused, in which statuses, and whether pauses are applied consistently and visible in the report.
What is the difference between response time and resolution time?
Response time measures how quickly a ticket is acknowledged or first worked on. Resolution time measures how long it takes to fix the problem. Users generally care about resolution, so ask for both by priority.
How often should we audit our MSP's SLA reports?
A short quarterly review works well for most organisations, with a fuller review before each contract renewal. Frequent light-touch checks catch definitional drift and recurring faults before they become disputes.
Can we ask our provider for raw ticket data?
You can ask, and a transparent provider will normally agree to supply an export or give access to a reporting view. Check your contract for data and reporting clauses, and if they are missing, add them at renewal.
How do we measure end-user satisfaction independently?
Run your own short pulse survey each quarter, phone a random sample of users about recent tickets, and gather feedback from team leaders. Compare the results with the provider's survey and the ticket data to find gaps.
Does a good SLA report mean we have good IT support?
Not on its own. It shows that tickets met defined targets under defined rules. Good support also means issues are fixed durably, users are confident, recurring faults are removed at the root and the provider is open about performance.
About this guide and NetMonkeys
Written by Caleb Adoh, Growth Marketing Manager at NetMonkeys. NetMonkeys is a Manchester-based Microsoft Solutions Partner with offices in Manchester, Nottingham and London and field engineers across around 12 UK cities, providing managed IT support, cyber security and virtual CIO services. This guide gives general information for UK businesses. Contracts, insurance policies and certification schemes differ, so check your own documents and current requirements, and take legal, insurance or financial advice where it matters.
Want a second opinion on your IT?
Talk to NetMonkeys about your current set-up, your contract and what a sensible next step looks like for your business.
Explore managed IT support Contact the team