
The Data Warehouse Toolkit: A Practical Guide to the Book
A guide to The Data Warehouse Toolkit by Ralph Kimball and Margy Ross: what it covers, who should read it, what still applies and what to adapt for cloud.
The quick answer
The Data Warehouse Toolkit is a book by Ralph Kimball and Margy Ross that teaches dimensional modelling, the approach behind most star schema warehouses. The third edition was published in 2013. Its core ideas, such as choosing the grain, conformed dimensions and the bus matrix, still apply. Some of its technology assumptions pre-date cloud platforms and need adapting.
Key takeaways
- The book is the standard reference for dimensional modelling and star schemas.
- Its four-step design process is the most reusable idea in it.
- The bus matrix and conformed dimensions help join subject areas together.
- The modelling principles still apply, but platform advice needs checking against cloud tools.
- Read it alongside current vendor documentation, not instead of it.
What is The Data Warehouse Toolkit?
The Data Warehouse Toolkit is a long-standing book on dimensional modelling, written by Ralph Kimball and Margy Ross. It sets out how to organise warehouse data into fact tables and dimension tables, and shows the techniques through many business scenarios.
The third edition appeared in 2013 and is the one most people buy. Earlier editions came out in the 1990s and 2000s, and the third was updated to reflect changes in the field. Check the publisher's page for the current edition before buying.
Practitioners treat it as a reference book more than a tutorial. You dip into the chapters relevant to your project, rather than reading it as a story. If you are still learning the terms, begin with a basic explanation of what a data warehouse is and come back to the book afterwards.
Our data warehouse services draw on dimensional principles like these, and the book is a good way to understand the thinking behind them.
↑ Back to contentsWho are Ralph Kimball and Margy Ross, and what is the Kimball approach?
Ralph Kimball is one of the best-known writers on data warehousing, and Margy Ross is his long-time colleague and co-author. The method they set out is often called the Kimball approach or dimensional modelling.
The approach starts from how the business measures and analyses its work. Data is modelled as business processes, with measurements in fact tables and descriptive context in dimension tables. The result is a model that business users can read, and that reporting tools can query quickly.
It is often contrasted with other styles, such as building a normalised central store first, or using data vault. Each has strengths, and our comparison of data vault and data warehouse approaches explains where they differ.
↑ Back to contentsWhat does the book cover?
The contents may differ slightly between editions, so check the table of contents for the edition you buy. In broad terms, the book covers the following.
- Dimensional modelling basics. What facts and dimensions are, how star schemas work, and how to choose the grain of a fact table.
- The design process. A repeatable method for turning a business process into a model.
- Bus architecture and the bus matrix. A planning tool for building many subject areas that fit together.
- Conformed dimensions. Shared dimensions that let separate fact tables be analysed together.
- Slowly changing dimensions. Techniques for handling attributes that change over time.
- Case studies. Worked examples from areas such as retail, orders, finance, human resources, healthcare, insurance and more.
- Loading and delivery. Guidance on the back-room processes that extract, clean and load data, and on how data reaches users.
Case studies are a strength. Seeing how an invoice, an insurance claim or a stock movement turns into a model is often more useful than abstract rules.
↑ Back to contentsWhat is the four-step design process?
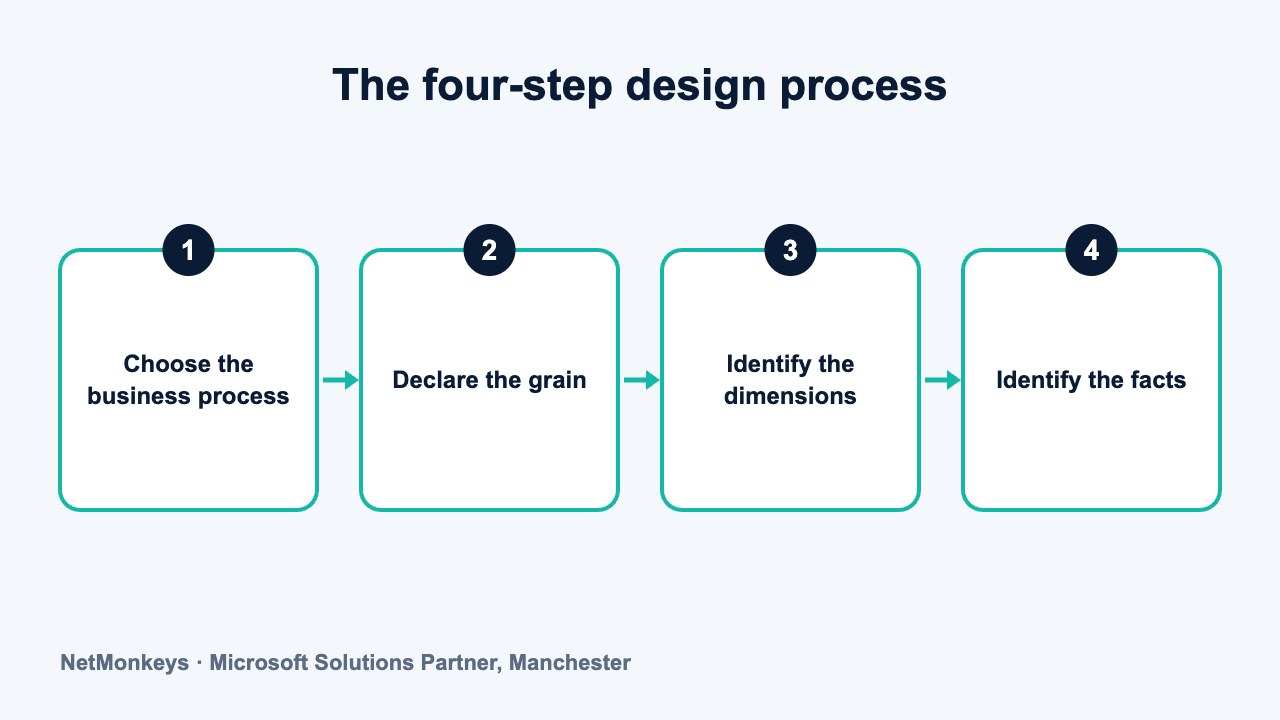
The most reusable idea in the book is a simple sequence for designing a dimensional model. It keeps design discussions focused and gives the business something concrete to review.
- Choose the business process. Pick one activity the organisation measures, such as taking orders or handling support tickets.
- Declare the grain. State exactly what one row in the fact table represents, such as one order line.
- Identify the dimensions. List the context that describes each row, such as customer, product, date and location.
- Identify the facts. List the numeric measures recorded at that grain, such as quantity and amount.
The order matters. Declaring the grain before adding dimensions and facts prevents tables that mix levels of detail. We walk through the same sequence in our guide to data warehouse design, with additional steps for testing, security and loading.
↑ Back to contentsWhat are the bus matrix and conformed dimensions?
The bus matrix is a simple grid. Rows are business processes, such as sales, shipments or support. Columns are the shared dimensions, such as date, customer or product. A mark in a cell shows that the process uses that dimension.
It is useful for two reasons. It gives the business a one-page view of the whole warehouse plan, and it shows which dimensions are shared and therefore need to be built carefully once. It also helps you prioritise, because you can pick the next process that reuses dimensions you have already built.
A conformed dimension is a dimension with the same meaning and keys wherever it is used. If sales and support both use one customer dimension, you can compare them in a single report. If each has its own version of customer, the numbers will not line up. Agreeing these shared definitions is mostly a business task, not a technical one.
What we would check first
When reviewing a warehouse, we often look at the customer and date dimensions first. If different reports define them differently, conformance is the underlying problem, whatever the platform.
How does the book deal with slowly changing dimensions?
Dimension attributes change. A customer moves, a product is renamed, a sales region is redrawn. The book describes several standard techniques for handling this, usually called slowly changing dimension types. The most common are summarised below.
| Technique | What it does | Use it when |
|---|---|---|
| Type 1 | Overwrites the old value with the new one | History is not needed, such as correcting a spelling error |
| Type 2 | Adds a new row for each version, with effective dates | Reports must show the facts against the attribute value that applied at the time |
| Type 3 | Stores the previous value in an extra column | You only need to compare the current and one earlier value |
The book describes further variants and hybrids, so check it for details. In practice, Type 1 and Type 2 cover most needs. The key is to decide, attribute by attribute, whether history matters to the business, and to record that decision.
↑ Back to contentsWhat does a worked example look like?
Here is a hypothetical example, using the four steps for a support team. It is illustrative only.
| Step | Decision |
|---|---|
| Business process | Handling support tickets |
| Grain | One row per ticket per day it is open |
| Dimensions | Date, customer, support agent, ticket category, priority |
| Facts | Tickets opened, tickets closed, minutes of handling time |
From this, a manager can ask how many high-priority tickets each team closed last month, or whether handling time is rising for one customer group. The same customer and date dimensions could later be reused for sales, which is where the bus matrix earns its place.
Notice what the example leaves out. It does not mention a platform, a tool or a pipeline. That is deliberate. The model is agreed with the business first, and the technology is chosen afterwards.
↑ Back to contentsWho should read it?
The book suits several readers, though not all in the same way.
- Data engineers and warehouse developers. It gives a shared vocabulary and tested patterns for modelling.
- BI developers and Power BI report builders. Understanding facts, dimensions and grain helps you build cleaner models and simpler measures.
- Analysts and data leads. Even without building, you can use the ideas to ask better questions of a data team.
- Project sponsors and managers. The chapters on planning, the bus matrix and business engagement help set realistic scope.
It is probably not the right first book for someone with no data background. It assumes some comfort with databases and reporting. Beginners may prefer a short introduction to warehouse basics before tackling a long reference.
↑ Back to contentsWhich parts are still useful, and which need adapting for cloud?
The modelling principles are independent of technology, which is why the book has lasted. Choosing the grain, building conformed dimensions and handling history are as relevant on a cloud platform as they were on a server in a back office.
The parts that need adapting are those tied to the technology of the time. Cloud platforms separate storage from compute, handle very large tables, and often load first and transform afterwards. Some performance advice, such as indexing and aggregate tables, may be less central or work differently now.
| Topic | Still applies? | What to check |
|---|---|---|
| Grain, facts and dimensions | Yes | Little needs adapting. Use as written. |
| Star schemas | Yes, in most reporting cases | Wide, denormalised tables are also common on cloud platforms. Choose based on the reporting tool. |
| Bus matrix and conformed dimensions | Yes | Useful for planning and governance on any platform. |
| Slowly changing dimensions | Yes | The techniques stand, but implementation varies by tool. Check the vendor's current documentation. |
| Indexing and physical tuning | Partly | Many cloud platforms manage this differently. Follow current vendor guidance. |
| ETL design | Partly | ELT, pipelines as code and streaming sources may not be covered in the depth you need. |
| Semi-structured and event data | Partly | Modern sources such as logs or application events may need approaches beyond the book. |
Treat the book as the source for the model and your platform's documentation as the source for the build. If you are on Microsoft tools, our Azure cloud services team can help you map one to the other.
↑ Back to contentsHow do you apply the book in a real project?
Do not try to implement everything. Pick one business process that matters, and follow the four steps. Draw the star schema on a whiteboard with the business owner before anyone writes a pipeline.
- Draft a bus matrix. List the main business processes and shared dimensions, even if you will only build one first.
- Pick the first process. Choose one with high value and reachable data, such as sales or support tickets.
- Declare the grain and review it. Confirm it with the people who know the process.
- Model one star schema. Keep names and definitions in business language.
- Build the shared dimensions carefully. Date, customer and product are reused, so invest in them.
- Deliver and review. Release the first star, collect feedback and extend using the matrix.
Then connect it to reporting. A clean dimensional model is a good foundation for Power BI and other tools. If your current pain is spreadsheets, stopping manual exports into Excel is often a good first outcome to target.
Common mistake
Reading the book as a set of rules to copy exactly. It is better used as a set of patterns. A small business with one source system may not need every technique, and may be better served by a simpler model.
Is the book enough on its own?
No single book is. The Data Warehouse Toolkit teaches modelling very well, but it does not choose a platform for you, set your security rules or run your pipelines. You will also want guidance on data warehouse architecture requirements, current platform documentation and your own data protection duties.
It also reflects one school of thought. Other approaches exist, and a good practitioner knows when each fits. If you want help applying dimensional modelling to your own data, a data warehouse consultancy can review your model or run the design with you.
If you want to test a model with business users before building it, business intelligence consultants can help prototype reports on a small data sample. And if your data prep happens in Excel or Power BI today, Power Query explained shows how that work can feed a dimensional model.
Finally, you do not need to agree with every point in the book to benefit from it. The core ideas are widely used because they make warehouses easier to understand and to use.
↑ Back to contentsFrequently asked questions
Who wrote The Data Warehouse Toolkit?
It was written by Ralph Kimball and Margy Ross. The third edition was published in 2013. Earlier editions were published under Ralph Kimball's name, with Margy Ross as co-author on later ones, so check the details of the edition you are buying.
Is The Data Warehouse Toolkit still relevant?
Yes, for the modelling principles. Grain, facts, dimensions, conformed dimensions and slowly changing dimensions all apply on cloud platforms. The technology-specific advice is older, so use current vendor documentation for platform and performance decisions.
Do I need to read the whole book?
Most people do not. Read the early chapters on the core ideas and the design process, then go to the case study closest to your own business. Use the rest as a reference when you meet a specific problem.
What is the Kimball approach in one sentence?
It is a method for building warehouses from business processes, using star schemas of facts and dimensions, with shared conformed dimensions joining the subject areas together.
Is the book useful for Power BI users?
Yes. Power BI works well with star schemas, so understanding facts, dimensions and grain helps you build cleaner models and simpler measures. You will still need Power BI's own documentation for features and settings.
What should I read alongside it?
Read your chosen platform's current documentation, and an overview of core warehouse concepts if you want broader context. For other approaches, look at material on data vault and on lakehouse designs.
About this guide and NetMonkeys
Written by Caleb Adoh, Growth Marketing Manager at NetMonkeys. NetMonkeys is a Manchester-based Microsoft Solutions Partner offering data warehouse services, Power BI services and business intelligence consultancy. This guide explains general data warehousing practice. Vendor products and features change, so check the current vendor documentation before making platform decisions.
Planning a data warehouse?
Talk to NetMonkeys about what you need to report on, where your data lives and which approach fits your business.
Explore data warehouse services Contact the team