Data Warehouse Concepts Explained in Plain English
Data warehouse concepts explained one by one: facts, dimensions, grain, star schemas, ETL and ELT, staging, slowly changing dimensions, keys and more.
The quick answer
The core data warehouse concepts are facts and dimensions, grain, star and snowflake schemas, ETL and ELT, staging, slowly changing dimensions, surrogate keys, data quality, metadata and partitioning. Together they describe how data is loaded, shaped, kept accurate and made fast to query. Knowing them lets a business reader follow a design discussion and ask better questions.
Key takeaways
- Facts are the measurements, dimensions are the descriptions, and grain says what one row means.
- A star schema is the usual starting point because it is simple to understand and fast to query.
- ETL and ELT differ in where the transformation happens, and staging sits in front of both.
- Slowly changing dimensions and surrogate keys keep history accurate when things change.
- Data quality, metadata and partitioning keep a warehouse trusted and fast as it grows.
What are the core data warehouse concepts?
Data warehouse concepts are the shared vocabulary of the people who design and run warehouses. They cover how data is arranged, how it is loaded, how history is kept and how quality is checked. You do not need to master them to commission a warehouse, but you will make better decisions if you understand the terms.
This page is a reference. It gives a one-line glossary first, then a short explanation of each concept. If you are new to the subject, start with what is a data warehouse, then return here.
We keep this at the conceptual level. Detailed design choices are covered in data warehouse design, and the way platforms implement these ideas changes often, so check the vendor's current documentation for specifics. If you want help applying them, our data warehouse services page explains how we work.
↑ Back to contentsA glossary of the main concepts
| Concept | Plain meaning | Why it matters |
|---|---|---|
| Fact | A recorded event or measurement, such as a sale or an invoice line | It holds the numbers you total and compare |
| Dimension | A description of the who, what, where and when around a fact | It lets you slice the numbers by customer, product, place or date |
| Grain | What a single row in a fact table represents | It decides which questions the data can answer |
| Star schema | A central fact table surrounded by dimension tables | Simple to understand and quick to query |
| Snowflake schema | A star schema where dimensions are split into further tables | Reduces repetition but adds joins |
| ETL | Extract, transform, then load into the warehouse | Cleans data before it arrives |
| ELT | Extract, load, then transform inside the platform | Uses the warehouse engine for the heavy work |
| Staging | A holding area for raw data on arrival | Keeps an untouched copy for tracing and reloading |
| Slowly changing dimension | A rule for handling descriptions that change over time | Keeps history accurate |
| Surrogate key | A warehouse-generated identifier for each dimension row | Stays stable when source codes change |
| Data quality | Checks that data is complete, valid and consistent | Decides whether people trust the figures |
| Metadata | Data that describes the data: sources, meanings, owners | Makes the warehouse understandable and auditable |
| Partitioning | Splitting large tables into manageable parts | Improves speed and simplifies maintenance |
What are facts and dimensions?
Most warehouse models separate two kinds of table. Fact tables record what happened. Dimension tables describe the context.
Think of a sales order line. The quantity and the value are facts: numbers you can add up. The customer, the product, the sales region and the order date are dimensions: labels you use to group and filter those numbers.
- Facts are usually numeric, usually additive, and there are lots of them. Examples: revenue, units, hours worked, tickets closed.
- Dimensions are descriptive and far fewer in number. Examples: customer, product, employee, date, cost centre.
- Measures are the specific numbers within a fact, such as net value or discount.
- Attributes are the descriptive fields within a dimension, such as customer sector or product category.
Good dimensional modelling is about choosing the right facts and dimensions for the questions you need to answer. We cover the wider process in design guidance, and the classic book on the subject is reviewed in The Data Warehouse Toolkit.
↑ Back to contentsWhat is grain, and why does it matter?
Grain is the level of detail that one row of a fact table represents. It is the single most important decision in a model, and the one most often left vague.
For a sales fact, the grain might be one row per order line, one row per order, or one row per customer per day. Each choice answers different questions. Order line grain can tell you which product sold. Daily customer grain cannot.
- Choose the finest grain you can justify. You can always summarise detail upwards. You cannot recover detail you never kept.
- State the grain in one sentence. For example, one row per invoice line per day of posting.
- Never mix grains in one fact table. Mixing them produces double counting and totals that look right but are wrong.
- Match grain to the question. If nobody needs line detail, a coarser grain may be cheaper and quicker.
What we would check first
When we review an existing model, we ask for the grain of each fact table in one sentence. If the team cannot give it, or gives different answers, that table is usually the source of the numbers nobody trusts.
What are star and snowflake schemas?
A schema is the pattern in which tables are arranged and joined. Two patterns dominate dimensional modelling.
In a star schema, one fact table sits in the middle and each dimension connects directly to it. The picture looks like a star. Queries are simple, reports are fast and business users can usually follow the model.
In a snowflake schema, dimensions are normalised into several linked tables. A product dimension might split into product, category and department tables. This removes repeated text and can ease maintenance, but it adds joins and makes the model harder to read.
| Aspect | Star schema | Snowflake schema |
|---|---|---|
| Structure | Dimensions are single, flat tables | Dimensions are split into linked tables |
| Ease of understanding | High | Lower |
| Query simplicity | Fewer joins | More joins |
| Repeated data | Some repetition in dimensions | Less repetition |
| Typical use | Default choice for reporting models | Where a dimension has a genuine hierarchy to manage |
For most reporting needs, a star schema is the sensible starting point. Tools such as Power BI work well with it. Snowflaking is worth considering only when it solves a real maintenance problem.
↑ Back to contentsWhat is the difference between ETL and ELT, and what is staging?
Both terms describe moving data from source systems into the warehouse. The difference is where the transformation work takes place.
- ETL (extract, transform, load) reshapes and cleans the data on a separate processing server, then loads the finished result into the warehouse.
- ELT (extract, load, transform) loads the raw data into the warehouse platform first and transforms it there, using the platform's own processing power.
- Which is better? Neither, always. ELT has become common on cloud platforms where compute is flexible. ETL still suits cases where data must be filtered or masked before it lands.
Staging sits in front of either approach. A staging area is where extracted data lands untouched. Keeping that raw copy gives you a record of what the source said at the time, and lets you rerun the transformation without going back to the source.
Staging also protects the source. You take a single, quick copy and do the heavy work elsewhere. Teams that skip staging often find they cannot explain a figure, because the original has changed or gone. For the movement side of the work, see system integration.
↑ Back to contentsWhat are slowly changing dimensions and surrogate keys?
Descriptions change. A customer moves region, a product moves category, an employee changes department. A slowly changing dimension is a rule for what the warehouse does when that happens.
- Overwrite (often called type 1). Replace the old value with the new one. History is lost, so reports restate the past using today's description.
- Add a new row (often called type 2). Keep the old row, mark it as ended and add a new row with start and end dates. History is preserved.
- Keep limited history (often called type 3). Store the previous value in an extra column. Useful for one specific comparison, such as old and new region.
The right choice depends on the question. If you report sales by the region a customer belonged to at the time, you need the row-versioning approach. If only the current region matters, overwriting is simpler.
Row versioning is why surrogate keys exist. A surrogate key is an identifier the warehouse generates for each dimension row, separate from any code in the source system. When one customer has three versions over time, each version has its own surrogate key, and each fact row points to the version that applied when it happened.
Surrogate keys also protect you from source changes. If a system is replaced and customer codes are reissued, the warehouse keys stay stable.
↑ Back to contentsHow do data quality and metadata fit in?
Data quality describes whether data is complete, valid, consistent and timely enough to rely on. In a warehouse it is managed through checks on the way in, such as missing values, duplicates, out-of-range numbers and records that do not match a known customer or product.
Good practice is to decide what happens to failures. Some should stop the load. Some should be loaded but flagged. Some should go to a review list for the business to correct. The decision belongs to the data owner, not the developer. Our article on improving data accuracy across departments covers the habits needed at source.
Metadata is data about the data. It records where each field came from, what it means, how it was calculated, who owns it and when it was last loaded. Without it, a warehouse becomes a black box that only its builders understand.
- Business metadata gives definitions in plain language, such as what counts as an active customer.
- Technical metadata records table structures, data types and load logic.
- Operational metadata records load times, row counts and failures.
Treat metadata as part of the deliverable. A data dictionary that is kept current is one of the cheapest ways to protect trust.
↑ Back to contentsWhat is partitioning, at a conceptual level?
Partitioning means splitting a large table into smaller parts, usually by date. Instead of one huge sales table, the platform manages a part for each month or year.
There are two practical benefits. Queries that ask about one period can skip the other parts entirely, which makes them faster. And maintenance becomes easier, because you can load, archive or delete a single part without touching the rest.
You do not need partitioning for small data sets, and some platforms handle it automatically. It becomes relevant as tables grow into very large volumes. How a platform implements it varies, so check the vendor's current documentation when you reach that point.
↑ Back to contentsHow do the concepts fit together, and where should you go next?
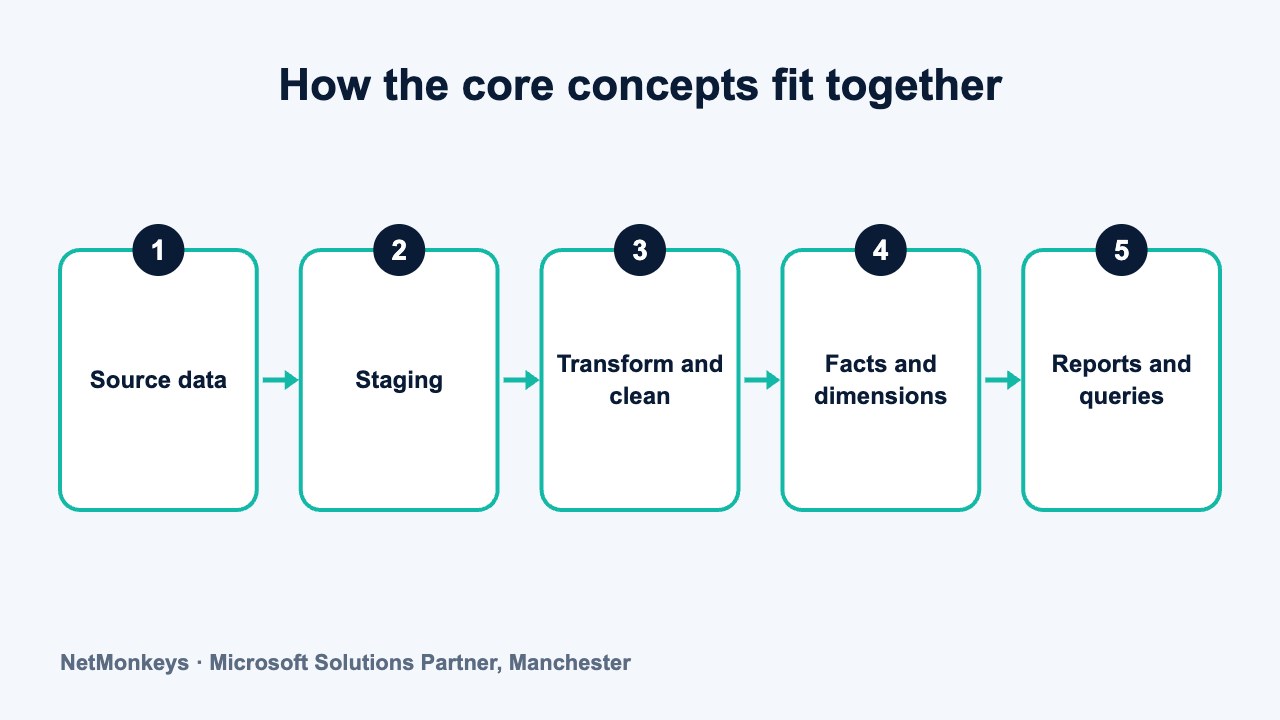
The concepts describe one pipeline. Here is how they connect:
- Extract data from the sources and land it in staging unchanged.
- Check data quality and record the results as metadata.
- Transform the data, using ETL or ELT, into clean dimension and fact tables.
- Apply the grain you chose and assign surrogate keys to dimension rows.
- Handle changes with the slowly changing dimension rule agreed for each dimension.
- Store in a star schema and, where tables grow large, partition them.
- Serve the result to reports and dashboards.
Other approaches exist. Data Vault, for example, is a modelling method with different goals, and data vault vs data warehouse explains where it fits. Dimensional modelling remains the usual choice for reporting-focused work.
If you want these concepts applied to your own data, NetMonkeys' data warehouse team can walk through your systems and questions. For the surrounding business reporting, our business intelligence consultants work alongside it.
↑ Back to contentsFrequently asked questions
What are the main concepts of a data warehouse?
The main concepts are facts and dimensions, grain, star and snowflake schemas, ETL and ELT, staging, slowly changing dimensions, surrogate keys, data quality, metadata and partitioning. Together they cover how data is shaped, loaded, kept accurate and made fast to query.
What is the difference between a fact table and a dimension table?
A fact table holds measurements from business events, such as sales values or hours worked. A dimension table holds the descriptions you use to group those measurements, such as customer, product or date. Reports combine the two.
Is ETL or ELT better for a data warehouse?
Neither is better in every case. ELT suits cloud platforms with flexible processing, because the warehouse does the transformation. ETL suits cases where data must be cleaned, filtered or masked before it reaches the warehouse. Many organisations use a mix.
Why do I need a staging area?
A staging area keeps an untouched copy of extracted data. It lets you trace figures back to the source, rerun transformations without re-extracting, and reduce load on live systems. Without it, fixing errors and explaining numbers is much harder.
What is a slowly changing dimension in simple terms?
It is a rule for handling descriptions that change, such as a customer moving region. You can overwrite the old value, keep both versions with dates, or store the previous value in an extra column. The choice depends on whether you need to report on the past as it was.
Do small businesses need to understand all of these concepts?
No. A small project may use only a few of them. Grain, facts and dimensions, and data quality matter in almost every case. The rest become relevant as data volumes, history requirements and the number of sources increase.
About this guide and NetMonkeys
Written by Caleb Adoh, Growth Marketing Manager at NetMonkeys. NetMonkeys is a Manchester-based Microsoft Solutions Partner offering data warehouse services, Power BI services and business intelligence consultancy. This guide explains general data warehousing practice. Vendor products and features change, so check the current vendor documentation before making platform decisions.
Planning a data warehouse?
Talk to NetMonkeys about what you need to report on, where your data lives and which approach fits your business.
Explore data warehouse services Contact the team